


As we closed the first quarter of 2026, markets continued to reflect a complex mix of optimism, uncertainty, and ongoing volatility. Investors entered the year encouraged by moderating inflation and expectations surrounding interest rates, yet concerns surrounding economic growth, global trade pressures, and geopolitical uncertainty continue to create uneven market conditions across sectors.
During periods like these, it is important to remember that the Foundation’s investment philosophy is intentionally designed for the long term. Our approach remains grounded in diversification, disciplined asset allocation, and prudent stewardship rather than reacting to short-term market swings. While there are always portions of the market that may temporarily outperform more conservative strategies, we continue to believe that patience, consistency, and thoughtful risk management remain essential to preserving and growing ministry resources over time.
As we have often shared, diversified portfolios can sometimes feel “penalized for prudence” during narrow periods of concentrated market performance. However, history consistently reminds us that disciplined investment management is not about chasing short-term headlines, but about maintaining a sustainable strategy capable of supporting ministry for generations to come.
We remain grateful for the continued guidance and partnership of CAPTRUST and our outsourced Chief Fiduciary Officer, Hardy Reed, as together we continue to monitor the markets and position portfolios thoughtfully for both current opportunities and long-term objectives. We are also pleased to continue maintaining our CEFEX certification, reflecting our commitment to fiduciary excellence and prudent stewardship practices.
Most importantly, we remain deeply thankful for the trust churches, individuals, and ministry partners place in the Florida United Methodist Foundation. Every investment account, endowment, and Development Fund deposit ultimately represents ministry — lives being changed, churches being strengthened, and the ongoing work of Christ being supported throughout Florida and beyond.
Thank you for allowing the Foundation to walk alongside you in faithful stewardship.
ECONOMIC OUTLOOK
| After three straight years of double-digit gains, 2026 has handed investors one of the most complex environments in a generation. As recently as late January, the S&P 500 touched all-time highs and investor sentiment was broadly bullish. Eight weeks later, the Iran conflict, a constrained Federal Reserve, rising stress in private credit, and major unknowns about the business and economic impacts of AI have fueled market volatility. For investors, certainty is in short supply. |

HEADWINDS
Iran Conflict & Energy Shock
- The Strait of Hormuz closure is the largest energy supply disruption on record, already affecting gasoline, jet fuel, and diesel prices, with higher fertilizer and other commodity costs now working through supply chains.
- The duration of the disruption will determine whether it remains a manageable shock or a sustained economic drag.
A Constrained Fed
- Fed funds rate cuts that once seemed likely in 2026 are now in question as the Fed weighs the simultaneous inflation pressure and growth drag of higher energy costs.
Private Credit Stress
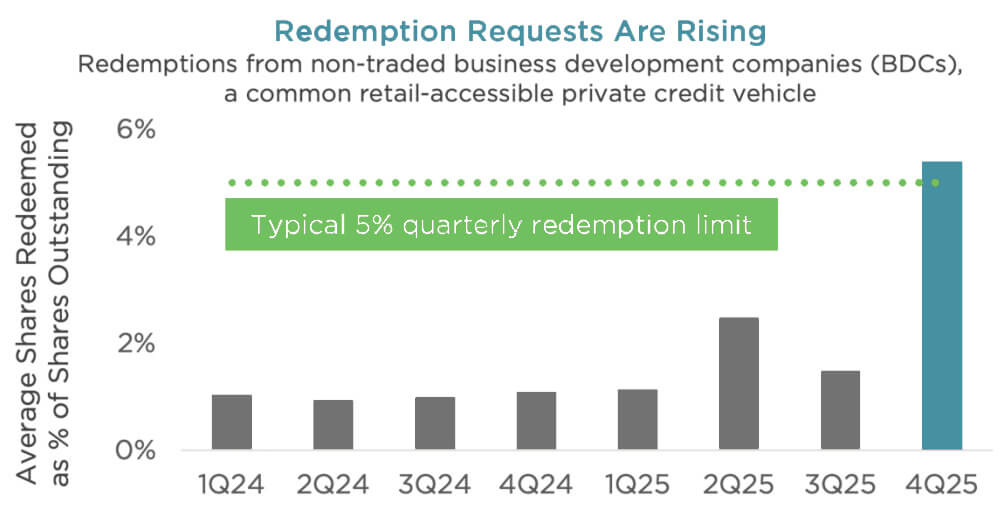
- The $1.8 trillion private credit market faces its first real test, as “wave of redemption requests has forced several funds to limit withdrawals.”
- While some investors see early signs of broader credit stress, others view this primarily as a liquidity mismatch in vehicles never designed for on-demand redemptions.

TAILWINDS
Fiscal Stimulus Supports Consumers
- The 2025 stimulus package provides a cushion at a critical moment, delivering larger average tax refunds just as energy prices rise. This provides a partial buffer but is unlikely to fully prolong energy shock.
U.S. Energy Independence
- Unlike in past Middle East crises, the U.S. as the world’s largest oil producer is far more insulated. U.S. exposure to the Hormuz disruption is limited; the impact is primarily through Japan, China, and the broader global energy supply.
Corporate Earnings Strength
- S&P 500 companies have posted five consecutive years of double-digit earnings growth, with 2026 earnings expectations rising despite the Iran conflict. Earnings resilience and broader beyond mega-cap tech, create a foundation for sustained market performance.
SHOCK OR CRISIS? DURATION WILL DECIDE
| The Iran conflict and resulting energy disruption naturally invite comparison to prior oil crises, some of which coincided with U.S. recessions. Historically, what separated temporary disruptions from lasting damage was not the scale of the price spike, but the economy’s structural vulnerability to it. As the world’s largest oil producer, the U.S. is far more insulated than in the past. But the longer prices stay elevated, the greater the risk of inflationary pressures, demand destruction, and economic damage. |
| EVENT | PRICE SHOCK DURATION | PEAK PRICE IMPACT | U.S. RECESSION |
|---|---|---|---|
| 1973 OPEC Embargo | 6 months | +381% † | Yes |
| 1978–79 Iran Revolution | 14 months | +205% † | Yes |
| 1980 Iran-Iraq War | 6 months | +17% † | Yes |
| 1990 Gulf War | 5 months | +155% | Yes |
| 2003 Iraq War | 5 months | +31% | No |
| 2022 Russia-Ukraine War | 7 months | +67% | No |
| 2026 Iran Conflict | 1+ month | +78% (through 3.31) | ? |
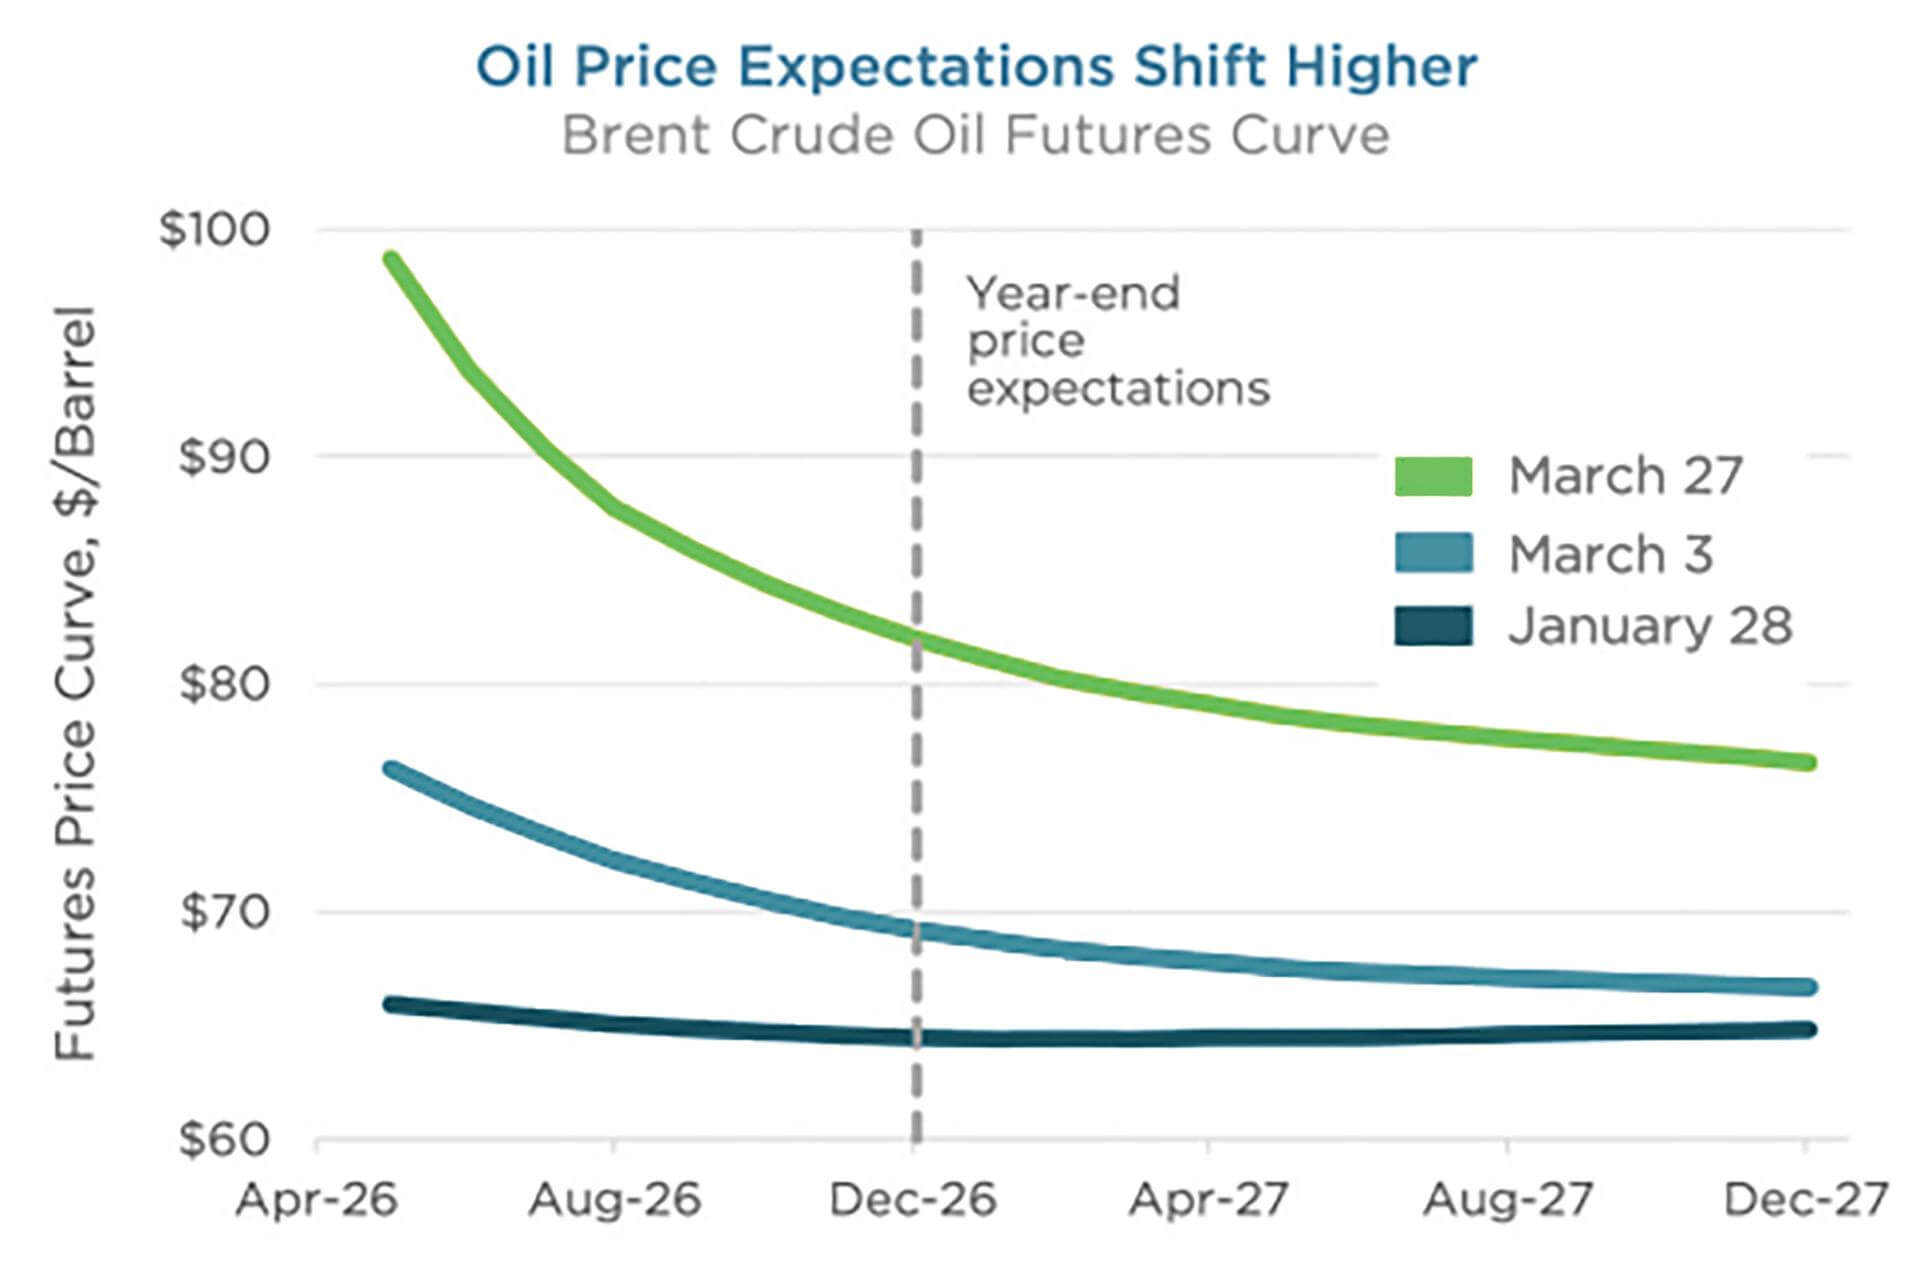
The Brent Crude futures curve (above, left) shows forward market expectations for oil prices. At the onset of the conflict, prices spiked but were expected to normalize by year-end. As fighting escalated, both spot prices and future price expectations moved sharply higher, implying a risk premium likely to persist even after the conflict is resolved.Much of the current supply outage stems from shipping and storage constraints, not permanent damage, suggesting faster recovery if the Strait reopens. However, infrastructure damage from further escalation could prolong the economic impact well beyond the conflict itself.
†Denotes monthly data. Price impact from 3-month pre-crisis baseline. Sources: FactSet, World Bank, U.S. Energy Information Administration (EIA), St. Louis Fed, National Bureau of Economic Research, CAPTRUST research. Duration reflects period of price dislocation. Prices reflect Europe Brent Spot (post-1987), Dubai Fateh (1985-1987), and Saudi Arabian Light (1970-1984).
STRENGTH UNDER THE SURFACE
The S&P 500 fell 4 percent in the first quarter, but the headline masks a more nuanced story. The decline reflected waning appetite for the market’s most expensive segments—not weakening earnings. Despite high uncertainty, 2026 earnings expectations continue to rise. The result is a market that appears weaker at the index level than it is beneath the surface.
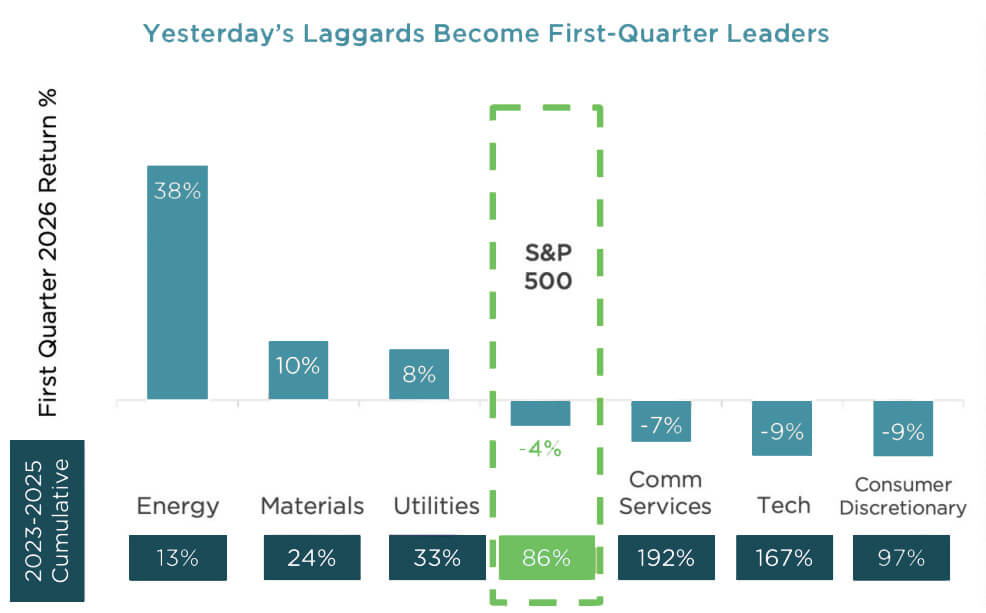
- First-quarter leadership shifted sharply from prior years. Energy, utilities, and materials—all three-year index laggards—surged as investors rotated out of expensive technology stocks. The key question now is whether this reflects durable leadership or a short-lived defensive trade tied to energy and AI fears.
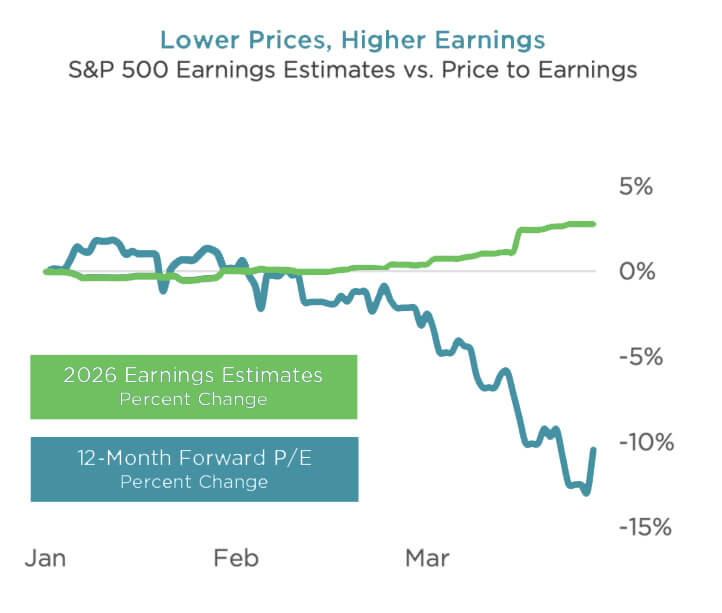
- Despite the overall index decline, 2026 earnings expectations improved. In aggregate, the first quarter drawdown was driven by price-toearnings (P/E) compression, not falling earnings. This is a critical distinction, as valuation-driven declines tend to reverse more quickly than earnings-driven ones.
Source: FactSet, CAPTRUST research. Data as of 3.31.2026
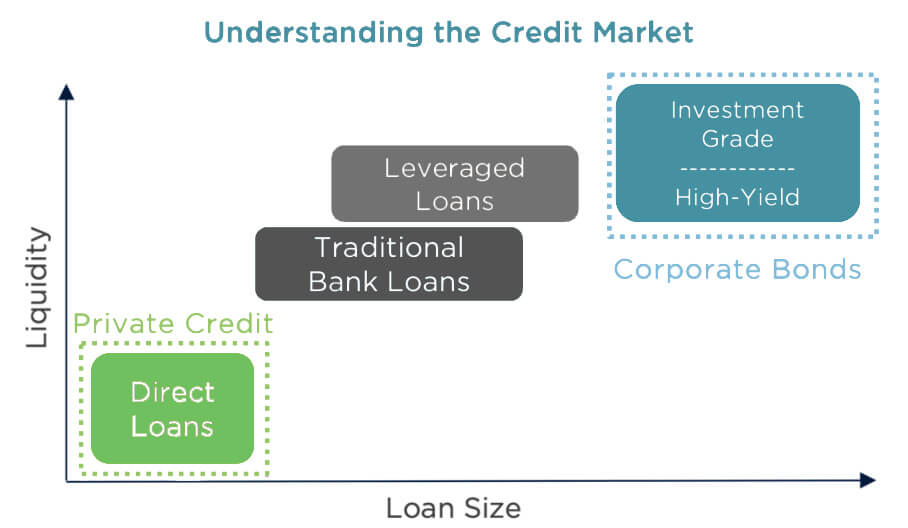
PRIVATE CREDIT FACES A TEST
| The private credit market has more than doubled in size over the past decade, as non-traditional lenders filled the void created by tighter bank lending standards after the global financial crisis. However, recent concerns about portfolio health and transparency have triggered elevated redemption requests from some private credit funds, prompting managers to limit withdrawals. The question is whether this reflects emerging stress, a mismatch with investor liquidity expectations, or some combination of both. |
- One concern among private credit investors is high exposure to software and other AI-vulnerable companies. Unlike public markets, private credit valuations are set quarterly by managers and third parties, limiting transparency.
- Limited liquidity is an important part of the private credit risk-return profile. Borrowers are typically mid-sized firms too small to access public markets, and therefore willing to pay a premium for direct lending. Funds impose withdrawal limits to manage the resulting liquidity mismatch. Recently, elevated redemption requests have led some funds to restrict or gate withdrawals on a pro-rata basis.
- This strain does not seem to signal a systemic crisis, but it is a reality check. A decade of strong inflows may have masked the importance of manager quality and underwriting discipline. Redemption gates are functioning as designed to protect long-term investors. But this episode is a reminder that illiquidity is a key attribute of the asset class, and will likely slow new capital inflows and raise the bar for manager selection.
Sources: SEC Filings, iCapital Insight. Redemption requests data reflects eight of the largest non-publicly traded BDCs.